If you have been ANYWHERE on the internet in the last year I’m sure you have taken note of a new trend in information presentation called “Infographics.”
Specifically…infographics are: “visual representations of information, data or knowledge intended to present complex information quickly and clearly. They can improve cognition by utilizing graphics to enhance the human visual system’s ability to see patterns and trends. The process of creating infographics can be referred to as data visualization, information design, or information architecture.” – Wiki
They have been around for hundreds of years, but it was not until recently that advertisers (or anyone wanting to share knowledge really) noticed the lasting impact they had on the inhabitants of this digital age. Let’s face it. Reading is fun, but not when the reading material in front of you looks more like an accountants daytime fantasy than a fun pop-up graphic. Which is why infographics work so well. They are engaging. Usually colorful, and if you stumble upon the right one…it will most likely have a really cute monkey on it. (You can’t hate a monkey right?)
Anyways, as a person who spends a LOT of time on the computer I have stumbled upon a plethora of infographics I thought y’all would appreciate. So I’ve decided to share.
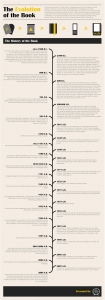
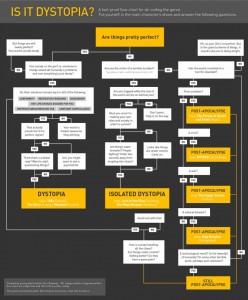
For your convenience I have dropped them into categories Also…they are jam packed with info (and pretty long) so to make this post more orderly I’ve posted them as thumbnails. If you would like to take a peek at the graphic in its full technocolored beauty, just CLICK TO ENLARGE. Also…be sure to stop down at the bottom of the page and tell me what you think!
E-Readers
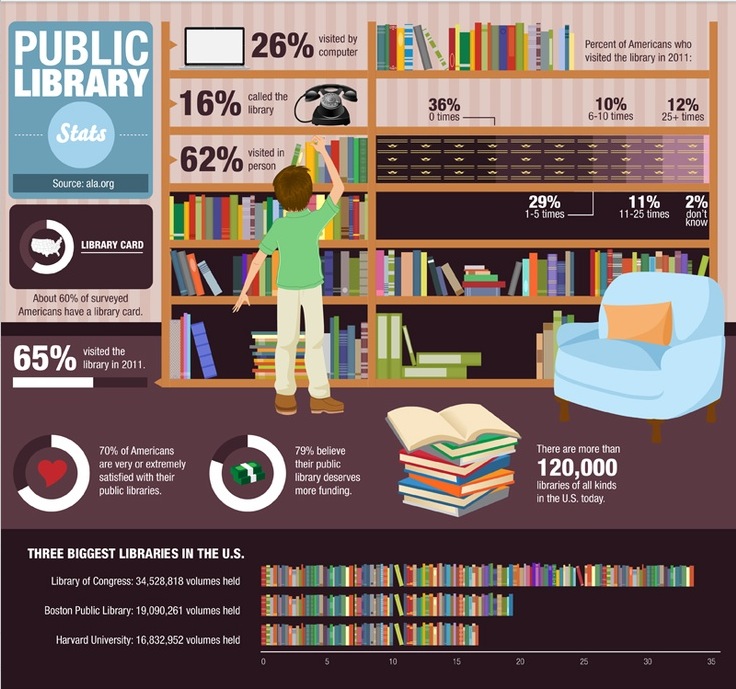
Libraries
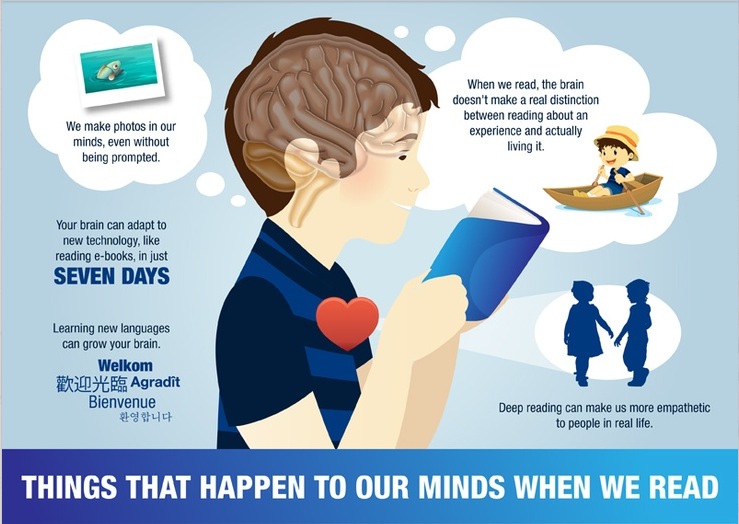
Reading

